Strategic Enrollment Leadership for District Sustainability 

Align your resources with real-time enrollment and future population shifts to ensure long-term fiscal health.

Moving from Budget Uncertainty to
Fiscal Predictability

From Guesswork to Revenue Security:

Shift from estimated figures to precise, real-time enrollment data that directly impacts state funding and annual budget planning.

Market Position Intelligence:

Analyze student transfer patterns and "out-migration" to understand why families leave and how to improve district retention.

Capital & Facility Optimization:

Use long-term demographic forecasts to justify major facility investments, school closures, or new construction to the board.

Equity-Driven Resource Allocation

Identify underserved neighborhoods through geographic density mapping to ensure programs and staffing reach every student fairly.

Products 

Enrollment Dashboard

Resource Planner 

AI-Powered Executive Dashboard

Industries

Large Urban Districts

Multi-Academy Trusts

Regional Education Service Agencies

Goal

Long-term Fiscal Sustainability

Market Retention

Equitable Resource Distribution 

Metrics

Capture Rate vs. Charters

Net Revenue per Student

Long-range Yield

Attrition ROI

Empowering Executive Leadership with Fiscal Clarity

A unified view of district performance allows the board to shift from monitoring activities to measuring outcomes:

98% Budget Accuracy:

Precisely forecast student counts to eliminate mid-year budget claw backs and financial surprises.

10-Year Planning:

Leverage AI projections to justify $50M+ in facility investments with verifiable population data.

Capture Market Share:

Track transfer trends to identify and reclaim 15% of students lost to charter or private options.

Recover 40+ Hours:

Replace manual reporting with a unified view, saving the cabinet dozens of hours every month.

Next-Gen Enrollment Dashboard — Executive Oversight Focus

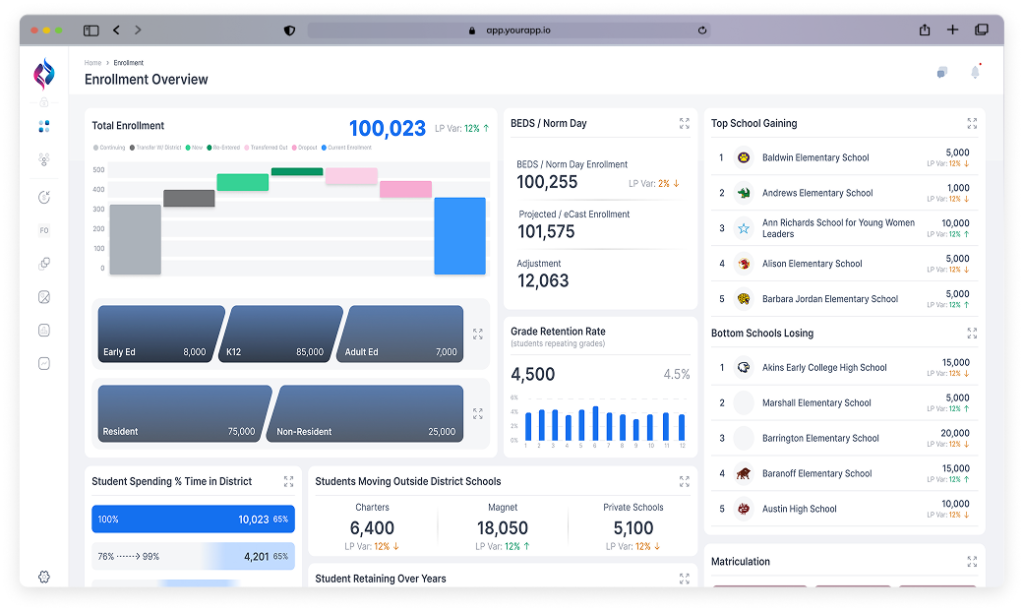
This AI-Powered interface is custom-built for VP-level decision-making:

Revenue Impact Maps

Visualize how enrollment shifts in specific zones affect the total operating budget.

Competitive Analysis

Pinpoint neighborhoods where the district is losing students to private or charter options.

Population Modeling

View forecasts that combine housing permits and birth rates to predict 10-year building needs.

Retention Risk Alerts

Identify patterns in student withdrawals before they impact district-wide health.

Board-Ready Summaries

Access high-level visuals designed to build trust and consensus during public meetings.

How its Works

Integrates

Connects SIS data with external housing and demographic databases.

Detects

AI identifies early indicators of student attrition and shifts in neighborhood density.

Models

Simulates the financial outcome of boundary changes or new program launches.

Standardizes

Unifies fragmented department data into a single source of truth for the cabinet.

Secures

Provides the evidence needed to defend strategic fiscal decisions to the community.

Target Audience for Governance & Accountability

Vice President of Enrollment

Chief Financial Officer (CFO)

Chief Operating Officer (COO)

Director of Communications

Board of Education Members

Let’s discuss your District’s Growth Roadmap

Are you looking to stabilize your budget, improve student retention, or justify facility investments? Discover how the Enrollment Dashboard transforms complex data into a strategic roadmap for district-wide sustainability.

What to Expect in Your
30-Minute Chat

  • Executive Strategy Demo: See how high-level enrollment trends impact your district’s financial health.
  • Market Position Review: View patterns of student movement and learn how to reclaim market share.
  • Forecast Accuracy Audit: Learn how AI-driven projections can replace manual estimates for your next budget cycle.

Request a Demo