
About This Article
State education agencies are expanding how they define student success. While graduation rates and standardized assessments remain essential, they no longer provide a complete picture of how well students are prepared for life beyond school. This article explores why a broader view of graduate readiness matters and how a GPS Dashboard helps state leaders monitor student progress, strengthen accountability, and support continuous improvement through connected, real-time insights.
Quick Summary
Traditional accountability measures show what students have achieved. A GPS Dashboard helps state education agencies understand how students are progressing by bringing together academic performance, student well-being, civic engagement, and college and career readiness in one connected view. This enables more informed planning, earlier intervention, and stronger statewide decision-making.
For decades, state education agencies (SEAs) have relied on a limited set of metrics, primarily graduation rates and standardized test scores, to measure student and school success. While these indicators remain important, they provide only part of the picture. Today’s educational mission extends beyond graduation to preparing every learner for college, careers, and civic life.
Meeting that goal requires a broader understanding of student progress across the entire educational journey. State leaders need timely, connected information that helps identify emerging trends, allocate resources more effectively, and better understand how different factors contribute to long-term student success.
This is the purpose behind the Graduates Proceed to Succeed (GPS) Dashboard. Rather than focusing solely on compliance reporting, it provides state education agencies with a comprehensive view of graduate readiness, helping leaders monitor progress, strengthen accountability, and support continuous improvement across districts.
The Pitfalls of a Limited View
The traditional focus on siloed, end-of-year data creates significant challenges for educational leaders.
Delayed Intervention
Data that becomes available only after students graduate offers limited opportunity to influence outcomes. State leaders often struggle to identify academic or well-being challenges while students are still progressing through school—when timely support can have the greatest impact.
Misaligned Resources
Without a clear, longitudinal view of student progress across multiple indicators, state and district leaders may find it more difficult to align funding, programs, and support services with areas of greatest need.
Limited Visibility
Public trust is strengthened through transparency. Graduation rates and assessment scores remain valuable measures, but they do not fully communicate whether students are developing the knowledge, skills, and experiences needed for success beyond high school.
| Traditional Accountability | Graduate Readiness Perspective |
|---|---|
| Graduation rates | Academic progress over time |
| Standardized assessments | Multiple indicators of student success |
| Annual reporting | Continuous progress monitoring |
| Individual metrics | Connected student outcomes |
| Historical performance | Data that supports informed planning |
These challenges are encouraging state education agencies to adopt a broader, more connected approach to understanding student success.
The GPS Difference: A More Complete View of Student Success
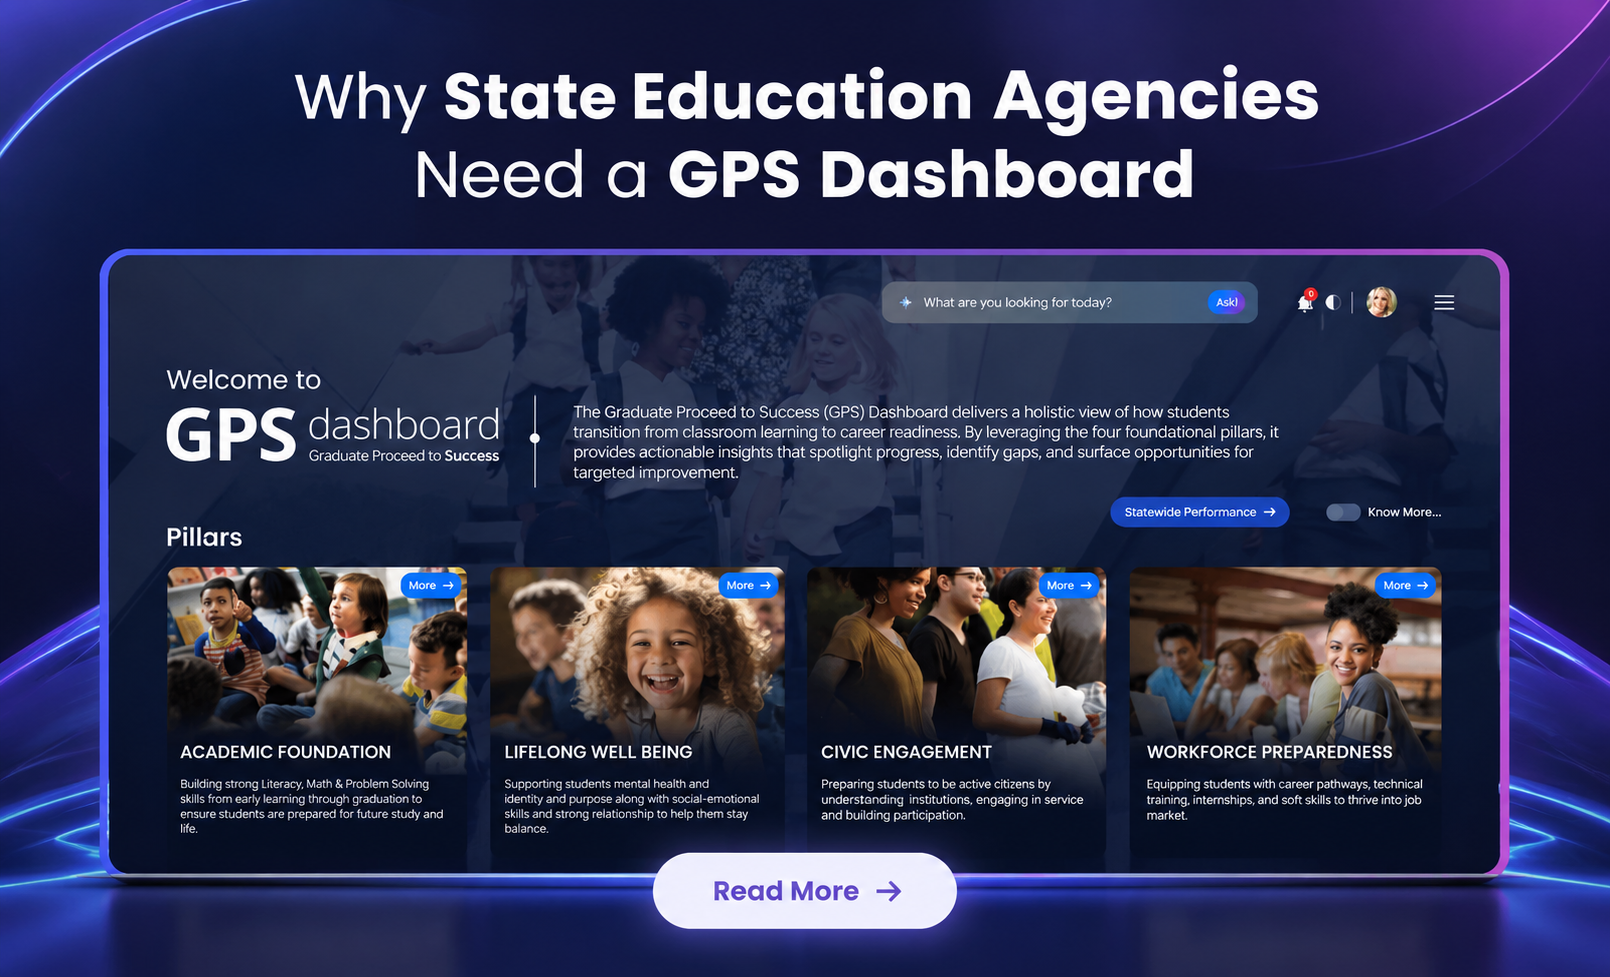
The platform organizes student progress across four interconnected pillars, giving leaders a broader understanding of how academic achievement, well-being, civic participation, and postsecondary outcomes work together to prepare students for success. This connected approach enables more informed planning, stronger accountability, and better alignment of statewide initiatives with student needs.
1. Academic Foundation
Academic achievement remains one of the strongest indicators of future success, but it should be viewed as a continuous journey rather than a single assessment result.
This pillar tracks core learning outcomes from early grades through graduation by incorporating Enrollment, Attendance & Absenteeism, Dropout Rates, Assessments, and Graduation Rates into one connected view. Looking at these measures together provides a more complete understanding of student progress than relying on test scores alone.
2. Lifelong Well-Being
Success in school and life is closely connected to physical, mental, and social well-being.
This pillar brings together essential indicators that often exist in separate systems, including Student Discipline, Poverty & Hunger Rates, and Health Insurance Coverage. Viewing these measures together helps state leaders better understand the broader factors influencing learning while supporting more informed decisions around student services and resource allocation.
By connecting these indicators, education agencies gain greater visibility into the conditions that influence long-term student success.
3. Civic Engagement
Preparing students for life beyond school includes helping them become active, engaged members of their communities.
This pillar measures participation in experiences that foster leadership and civic responsibility, including Leadership Program Participation and Pre-Apprenticeship Participation. These indicators reinforce the importance of leadership, collaboration, and community involvement as essential components of a well-rounded education.
Monitoring civic engagement alongside academic measures provides a broader perspective on how schools prepare students for success beyond graduation.
4. Workforce Preparedness
Preparing students for postsecondary success is a central goal of K–12 education.
This pillar tracks outcomes related to College & Career Readiness (AP, IB, and Dual Enrollment completion), Graduate Employment & Wages, and Financial Aid Access. Connecting these indicators with K–12 performance provides valuable insight into how effectively students are transitioning into higher education, careers, and the workforce.
These long-term outcomes also create an important feedback loop, helping state education agencies evaluate educational initiatives and strengthen curriculum planning for future students.
Together, these four pillars provide a more comprehensive understanding of student success than traditional accountability measures alone. Instead of focusing on isolated outcomes, state education agencies gain connected insights that support strategic planning, resource allocation, and continuous improvement across districts.
Turning Data into Action with AI-Powered Insights
One of the GPS Dashboard’s most valuable capabilities is its integrated AI-powered question-and-answer tool, designed to help state education agencies explore complex education data more efficiently. Instead of manually reviewing multiple reports or analyzing spreadsheets, leaders can ask questions in natural language and receive immediate, data-driven insights.
For example, state leaders can ask:
- Show math proficiency by economic subgroup in District A.
- Which districts improved graduation rates the fastest this year?
- What is the correlation between 3rd-grade reading scores and post-secondary employment in the Delta region?
By making complex data easier to explore, AI helps leadership teams spend less time searching for information and more time understanding trends, identifying opportunities, and supporting evidence-based decision-making. Rather than replacing human expertise, it enables faster access to insights that help guide statewide planning and continuous improvement.
Actionable Intelligence for All Stakeholders
The GPS Dashboard is more than a reporting solution. It provides state education agencies with a shared view of student progress that supports planning, collaboration, and transparency across the education system.
Pillar Insight Pages
Explore each pillar in greater detail to understand performance across schools, districts, student groups, and key indicators. These views help leaders identify trends, recognize successful practices, and better understand where additional support may be needed.
State Benchmarking
Compare district and regional performance against state averages, targets, and benchmarks. This helps education leaders monitor progress, identify variation across districts, and support more informed planning at the state level.
Public Transparency Mode
Build trust with families, policymakers, and community stakeholders through accessible, public-facing views of statewide educational outcomes. By making progress easier to understand, state education agencies can strengthen accountability and communicate the impact of educational initiatives more effectively.
Together, these capabilities help state education agencies move beyond reporting historical results toward supporting continuous improvement. By connecting insights across academic performance, student well-being, civic engagement, and workforce outcomes, leaders gain a stronger foundation for strategic planning and long-term student success.
Looking Beyond Graduation
Graduation is an important milestone, but it is only one measure of student success.
Preparing students for college, careers, and civic life requires understanding their progress across the entire educational journey. By bringing together academic performance, well-being, civic engagement, workforce outcomes, and AI-powered insights, the GPS Dashboard provides state education agencies with a broader perspective on how students are developing and where support can make the greatest difference.
Rather than simply reporting the past, state leaders gain the information needed to guide future improvement, strengthen accountability, and help ensure every graduate is prepared to succeed beyond high school.
FAQs
1. Who is the primary user of the GPS Dashboard?
The GPS Dashboard is designed for State Education Agency (SEA) leaders, superintendents, district administrators, and school leaders. It also supports public transparency through role-based reporting that provides appropriate access for families, policymakers, and community stakeholders.
2. How does the GPS Dashboard support graduate readiness?
The platform brings together multiple indicators—including academic performance, student well-being, civic engagement, and workforce preparedness—into one connected view. This helps education leaders monitor progress throughout the student journey rather than relying on end-of-year measures alone.
3. What are the advantages of AI-powered insights?
Leaders can ask questions using natural language and receive immediate, data-driven insights. This reduces time spent manually analyzing reports while supporting faster, evidence-based planning and decision-making.
4. How does the GPS Dashboard protect student data? ashboard track outcomes after students graduate?
The platform is designed to support state-level privacy and security requirements through secure access controls and role-based permissions. Public Transparency Mode presents aggregated information while helping protect individual student privacy.
5. Can the GPS Dashboard monitor outcomes after graduation?
Yes. The Workforce Preparedness pillar includes postsecondary indicators such as graduate employment and wage outcomes, financial aid access, and college and career readiness measures, providing valuable insight into long-term student success.