
About This Article
This guide explains how K-12 district leaders can move a strategic plan from a static document into a live execution system. It covers goal mapping, KPI tracking, role-based dashboards, AI alerts, data integration, and leadership routines that keep strategic priorities active throughout the year.
Quick Summary
A strategic plan works best when goals, data, accountability, and decision-making routines work together. Real-time dashboards let district leaders monitor progress, spot where support is needed, and keep board, cabinet, and school teams aligned.
Every superintendent knows the moment. A strategic plan has been approved, shared, and celebrated. Months later, the question becomes harder: how is that plan showing up in daily decisions across schools, departments, and leadership meetings?
For many districts, the challenge is not the plan’s quality. It is the distance between the written strategy and the systems used to manage progress. That is where real-time execution becomes important.
A live strategic plan dashboard brings goals, KPIs, data sources, and leadership routines together. Leaders no longer wait for annual updates. They can see what is moving, what needs attention, and where to act next.
Why Do Strategic Plans Lose Momentum?
Strategic plans often lose momentum when priorities are not connected to clear ownership, measurable indicators, and regular review cycles.
Recent survey highlights that execution depends heavily on leadership support, not just the work of teachers and students. In district settings, that means principals, cabinet leaders, and superintendents need shared visibility into progress and responsibility.
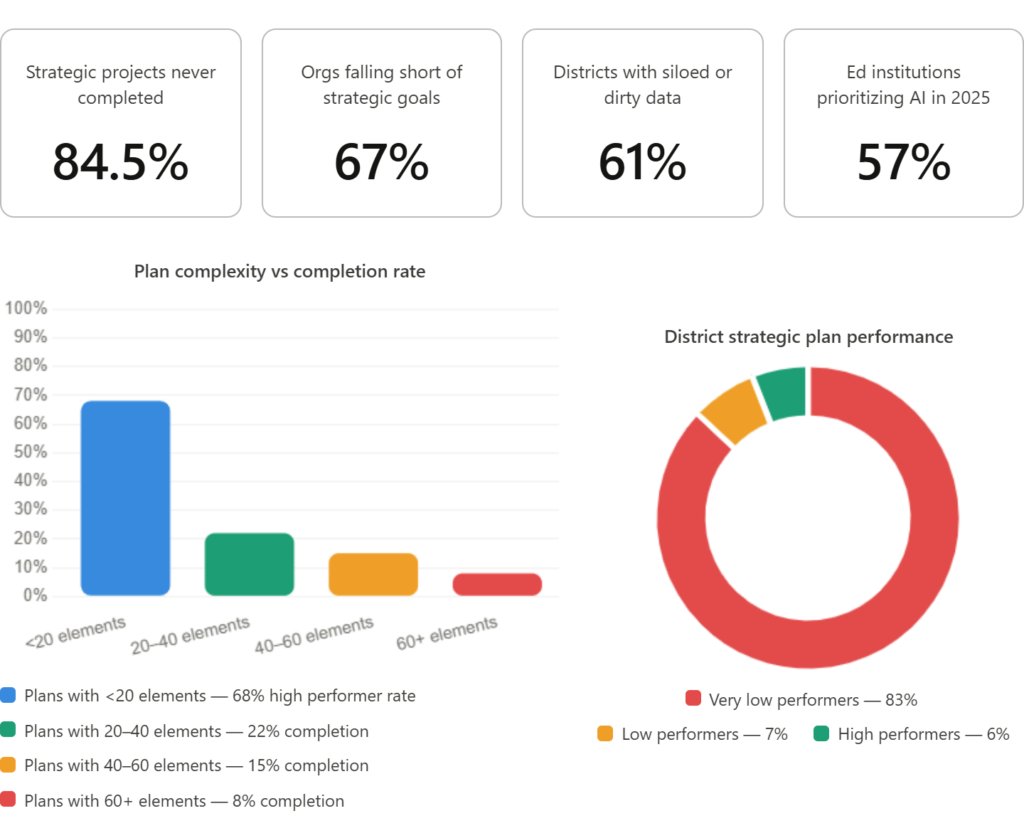
The data below visualizes the execution gap across organizations. Notice how complexity is inversely related to completion. The lesson is simple: a strong plan needs an operating system behind it.
What Makes a Strategic Plan Dashboard Work?
A live strategic plan system typically comprises four interconnected layers: goals, KPIs, live data, and AI alerts.
The 4-Component live strategic plan system
Goals
Vision to Priorities
KPIs
Measurable Outcomes
Live Data
SIS, LMS, Assesments
AI Alert
Early Risk Signals
Role Based dashoards – who sees what
Superintendent
District – wide KPI summary
Principals
School-level metrics
Cabinet
Initiative Ownership
Board
Transparency Reporting
| Component | What It Does |
|---|---|
| Goals | Clarifies the district’s most important priorities |
| KPIs | Turns goals into measurable progress indicators |
| Live Data | Connects information from district systems in near real time |
| AI Alerts | Flags trends, risks, or anomalies that may need attention |
Goals should be limited and focused. Research suggests strategic portfolios are more effective when they include a manageable number of goals, measures, and active projects.
Together, these layers create a feedback loop between planning and action.v
How Can Districts Map Goals to Real-Time Data?
The work usually begins with the plan districts already have.
Start by reviewing each strategic goal and identifying two to four measurable KPIs connected to that goal. Each KPI should have a clear data source, such as the SIS, LMS, assessment platform, HR system, or finance system.
A practical mapping process may look like this:
- Audit the current strategic plan.
- Identify measurable KPIs for each goal.
- Match each KPI to a reliable data source.
- Connect SIS, LMS, HR, finance, and assessment systems.
- Build dashboards by role and responsibility.
- Add AI alerts for high-priority indicators.
- Set a monthly or quarterly review cadence.
The roadmap below shows the full journey from your existing plan document to a fully integrated live system.
Step by step : from static plan to integrated live system
Step1
Audit and map goals to KPIs
Step 2
Connect SIS, LMS and finance
Step 3
Design role-based dashboard
L
L
Step 6
Publish board and community View
Step 5
Set review cadence and cycles
Step 4
Enable AI Alerts and anomaly flags
What Each Steps Connects in Your tech stack
Strategic Plan Docs
SIS
LMS/ Canvas
Finance/ERP
AI Dashboard
Board View
Fulton County Schools is an example of how complex district data can get. Their information spreads across many platforms. For many districts, the best first step is not adding more data. Instead, bring existing data into a structure that leaders can use.
Why Do Role-Based Dashboards Matter?
Not every leader needs the same view.
Superintendents need a districtwide picture of progress. Principals need school-level indicators. Cabinet members need progress tied to the initiatives they own. Board members and families often need a simplified public-facing view that explains progress in clear language.
Role-based dashboards help each group focus on the decisions they are responsible for making.
What Can North Carolina Teach About Data Accountability?
North Carolina offers a useful example of how data can become part of a broader education strategy.
The lesson for district leaders is not only about data science instruction. It is about creating a culture where data is visible, shared, and connected to improvement.
When classroom, school, district, and state-level teams work from common indicators, accountability becomes less about annual reporting and more about continuous learning.
How Does AI Support Strategic Plan Execution?
AI can support strategic plan execution by helping leaders identify patterns, summarize complex information, and surface issues that may need attention.
Gartner has forecast that AI agents will influence an increasing share of business decisions in the coming years, while CoSN has identified generative AI and data visualization as important technology enablers for educational innovation.
For K-12 districts, the practical opportunity is not replacing human judgment. It is reducing the time leaders spend searching through disconnected reports and giving them better context for decisions.
AI can help flag attendance shifts, KPI changes, budget variance, staffing patterns, or program trends. Leaders still decide what those signals mean and what action is appropriate.
How Can Districts Make the Shift from Static to Living?
Turning a strategic plan into a living system is less about technology alone and more about leadership discipline.
Districts need clear priorities, measurable indicators, regular review routines, and shared accountability. A dashboard makes the work visible, but leadership routines keep it active.
A living strategic plan helps leaders answer three questions throughout the year:
- Where are we making progress?
- Where do we need to adjust?
- What action should happen next?
That shift changes the role of the strategic plan. It moves from an occasionally reviewed document to a system that supports everyday leadership.
Frequently Asked Questions
What is a K-12 strategic plan dashboard?
A K-12 strategic plan dashboard links district goals to live data from systems such as SIS, assessment, finance, HR, and operations platforms. It helps leaders monitor progress and review KPIs during the year.
Why do district strategic plans lose momentum?
Plans lose momentum when goals lack clear ownership, measurable indicators, and regular reviews. Execution improves when leaders can see progress and act on current information.
What KPIs should superintendents track?
Common KPIs include academic growth, proficiency, attendance, chronic absenteeism, graduation rates, budget variance, staffing trends, retention, school climate, and progress on major initiatives.
What is the difference between internal and public dashboards?
Internal dashboards provide detailed data for district leaders, principals, and cabinet teams. Public-facing dashboards share high-level progress with boards, families, and communities in simple language.
How can AI improve strategic plan execution?
AI can help identify trends, flag anomalies, summarize complex information, and alert leaders when indicators move off track. It supports decision-making but does not replace leadership judgment.