Automating Data Pipelines for District-Wide Enrollment Integrity
Eliminate the cycle of manual SIS exports and complex spreadsheet reconciliation. Transform fragmented datasets into a single, high-fidelity source of truth that powers predictive modeling and eliminates data silos.
Automated SIS Integration
Eliminate manual exports with direct SIS integration. Enrollment, residency, and demographic data stay automatically updated.
Geographic Data Enrichment
Map student addresses GIS boundaries to validate residency, detect assignment gaps, and improve boundary reporting accuracy.
Longitudinal Data Modeling
Track cohorts and mobility trends over time to create more reliable long-term enrollment projections.
Validation and Anomaly Detection
Detect data errors, duplicates, and unusual enrollment shifts in real time to maintain clean, compliant datasets.
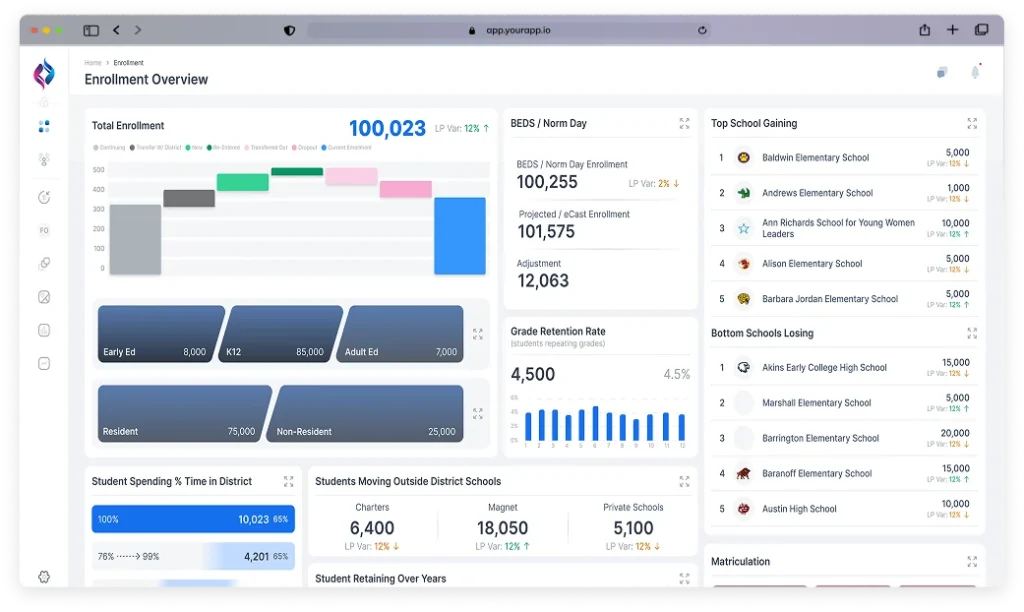
Enrollment Executive Summary
Products
Enrollment Dashboard
Data Integration Engine
Industries
K-12 IT Departments
Data & Research Offices
Goal
Data Accuracy
Process Automation
Systems Interoperability
Metrics
Sync Latency
Geocoding Success Rate
Forecast Variance
Empowering Data Teams with Technical Precision
Data professionals need tools that handle the heavy lifting of ETL processes. Here is how specialized intelligence enhances your data workflow:
Real-Time Data Normalization
Standardize disparate data formats from multiple sources into a unified schema. Ensure that your enrollment, HR, and facility data speak the same language for cross-departmental analysis.
Instant Geospatial Analysis
Automatically convert student addresses into precise map coordinates. Run complex redistricting scenarios without manual geocoding, saving days of technical labor during boundary reviews.
High-Performance Forecast Modeling
Leverage built-in predictive algorithms that account for historical yield rates and birth data. Deliver high-confidence models to leadership without building custom scripts from scratch
90% Reduction in Manual Reporting
Eliminate the time spent cleaning and formatting data for board presentations. Automate the generation of visual reports that are directly linked to your live data environment.
Next-Gen Technical Interface
This interface is built for the technical requirements of K-12 data management:
Live Data Sync Monitors
Track the status and health of your SIS and census data integrations in one view.
Cohort Tracking Modules
Analyze grade-level survival ratios and mobility trends with granular, subgroup-level filtering.
Boundary Impact Simulations
Run "what-if" scenarios to calculate the exact student count and demographic shift for any proposed boundary change.
API-First Connectivity
Ensure your enrollment data can easily feed into other district systems, from transportation to nutrition services.
How its Works
Syncs
Integrates with your Student Information System (SIS) and local demographic data.
Analyzes
Evaluates historical mobility, birth rates, and regional housing trends.
Maps
Displays enrollment patterns against school footprints and geographic boundaries.
Notifies
Automatically flag buildings reaching capacity or unexpected enrollment declines.
Projects
Delivers five-year forecasts for staffing requirements and revenue benchmarks.
Target Audience for This Use Case
Data Analyst
Information Systems Specialist
GIS Coordinator
Director of Technology & Data
Let’s discuss your Data Architecture
Are you ready to move from reactive registration to strategic enrollment planning? Let’s explore how a unified dashboard can provide the clarity needed to lead your district with confidence.
What to Expect in Your 30-Minute Chat
Executive Scenario Modeling: See how real-time data visualizes your district’s growth.
Staffing Alignment Review: Explore how to link enrollment forecasts to your long-term hiring plan.
Fiscal Impact Session: Learn how to use predictive data to secure and protect state aid.