Turning Student Data into a Roadmap for District Stability
Replace manual enrollment tracking with predictive insights. Align SIS data to balance school boundaries, optimize staffing, and protect district funding.
Moving from Reactive Registration to Strategic Enrollment
From Spreadsheets to Live Dashboards:
Replace fragmented manual logs with a real-time view of your current and projected student population.
Balance School Boundaries:
Identify over-capacity buildings early to adjust boundaries or redistrict with confidence using precise geographic data.
Anticipate "Bubble" Classes:
Use predictive analytics to spot sudden spikes in specific grade levels before they lead to overcrowded classrooms.
Secure Accurate Funding:
Ensure every student is accounted for during critical "count days" to maximize state aid and stabilize the district budget.
Board of Education View
Products
Enrollment Dashboard
AI-Powered Executive Dashboard
Industries
K-12 School Districts
Charter School Networks
Regional Education Service Agencies
Goal
Building Capacity Optimization
Accurate State Funding
Strategic Redistricting
Metrics
Student Yield Rates
Boundary Utilization
Mobility Trends
Forecast Accuracy
Empowering Enrollment Teams with Data Clarity
A unified view of district performance allows the board to shift from monitoring activities to measuring outcomes:
98% Forecast Precision:
Identify cohort bubbles months in advance to eliminate opening-day staffing surprises.
Instant Boundary Impact:
Model redistricting scenarios in minutes to visualize capacity and demographic shifts.
Proactive Resource Alignment:
Determine section additions and teacher reassignments well before the summer hiring peak.
Automated Data Sync:
Save 20+ hours weekly by replacing manual SIS exports with a live, unified registration view.
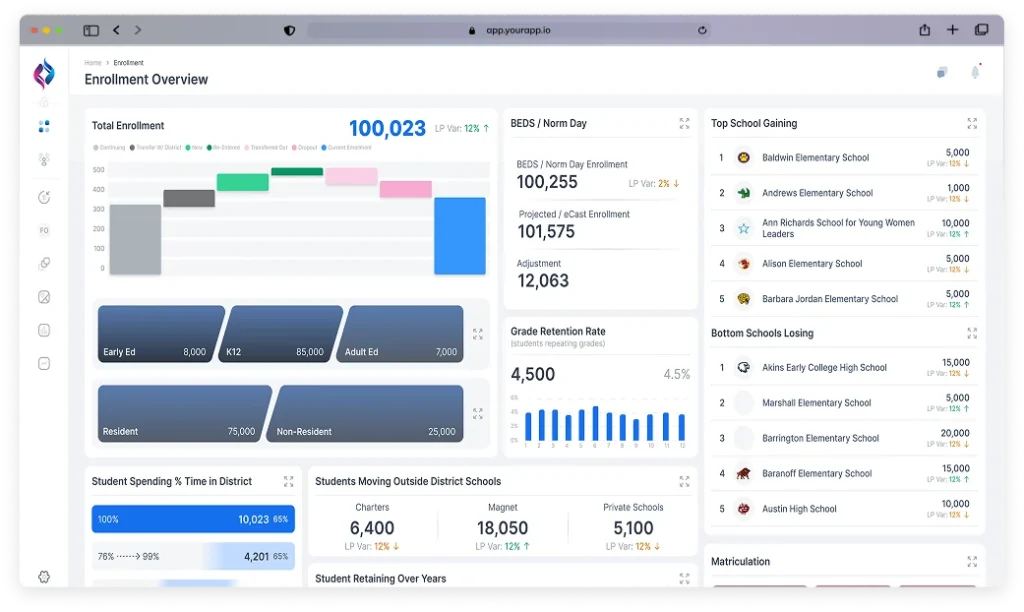
This AI-Powered interface is custom-built for enrollment oversight:
Geographic Density Heatmaps
Visualize student residency against school boundaries to identify overcrowding risks before they occur.
Grade-Level Growth Trackers
Monitor cohort survival ratios and grade-level bubbles to ensure building readiness for every transition.
State Aid Forecasts
Link student counts to potential revenue for precise, board-ready budget projections.
Registration Velocity Panels
Compare daily application trends against historical benchmarks to predict final Day 1 numbers.
One-Click Boundary Scenarios
Generate visuals showing how proposed redistricting impacts building utilization and student demographics.
How its Works
Syncs
Connects directly to your Student Information System and local census data.
Models
Projects future student density based on historical mobility and birth rates.
Visualizes
Maps enrollment trends against school building capacity and boundary lines.
Alerts
Flags emerging overcrowding risks or sudden enrollment drops in real-time.
Predicts
Forecasts long-term staffing needs and state funding levels for the next five years.
Target Audiencefor Enrollment & Planning
Enrollment Manager
Director of Student Services
Assistant Superintendent of Operations
Demographic & Planning Specialists
Registrars & School Secretaries
Let’s discuss your Enrollment Strategy
Are you looking to eliminate opening-day surprises, optimize building capacity, or automate your state funding reports? Discover how the Enrollment Dashboard transforms fragmented registration data into a clear roadmap for district stability.
What to Expect in Your 30-Minute Chat
Predictive Workflow Demo: See how your SIS data maps to future grade-level growth and building capacity.
Boundary Scenario Review: View how the dashboard models redistricting impact in real-time.
Funding Gap Analysis: Learn how to identify and capture every dollar of state aid through precise student counting.